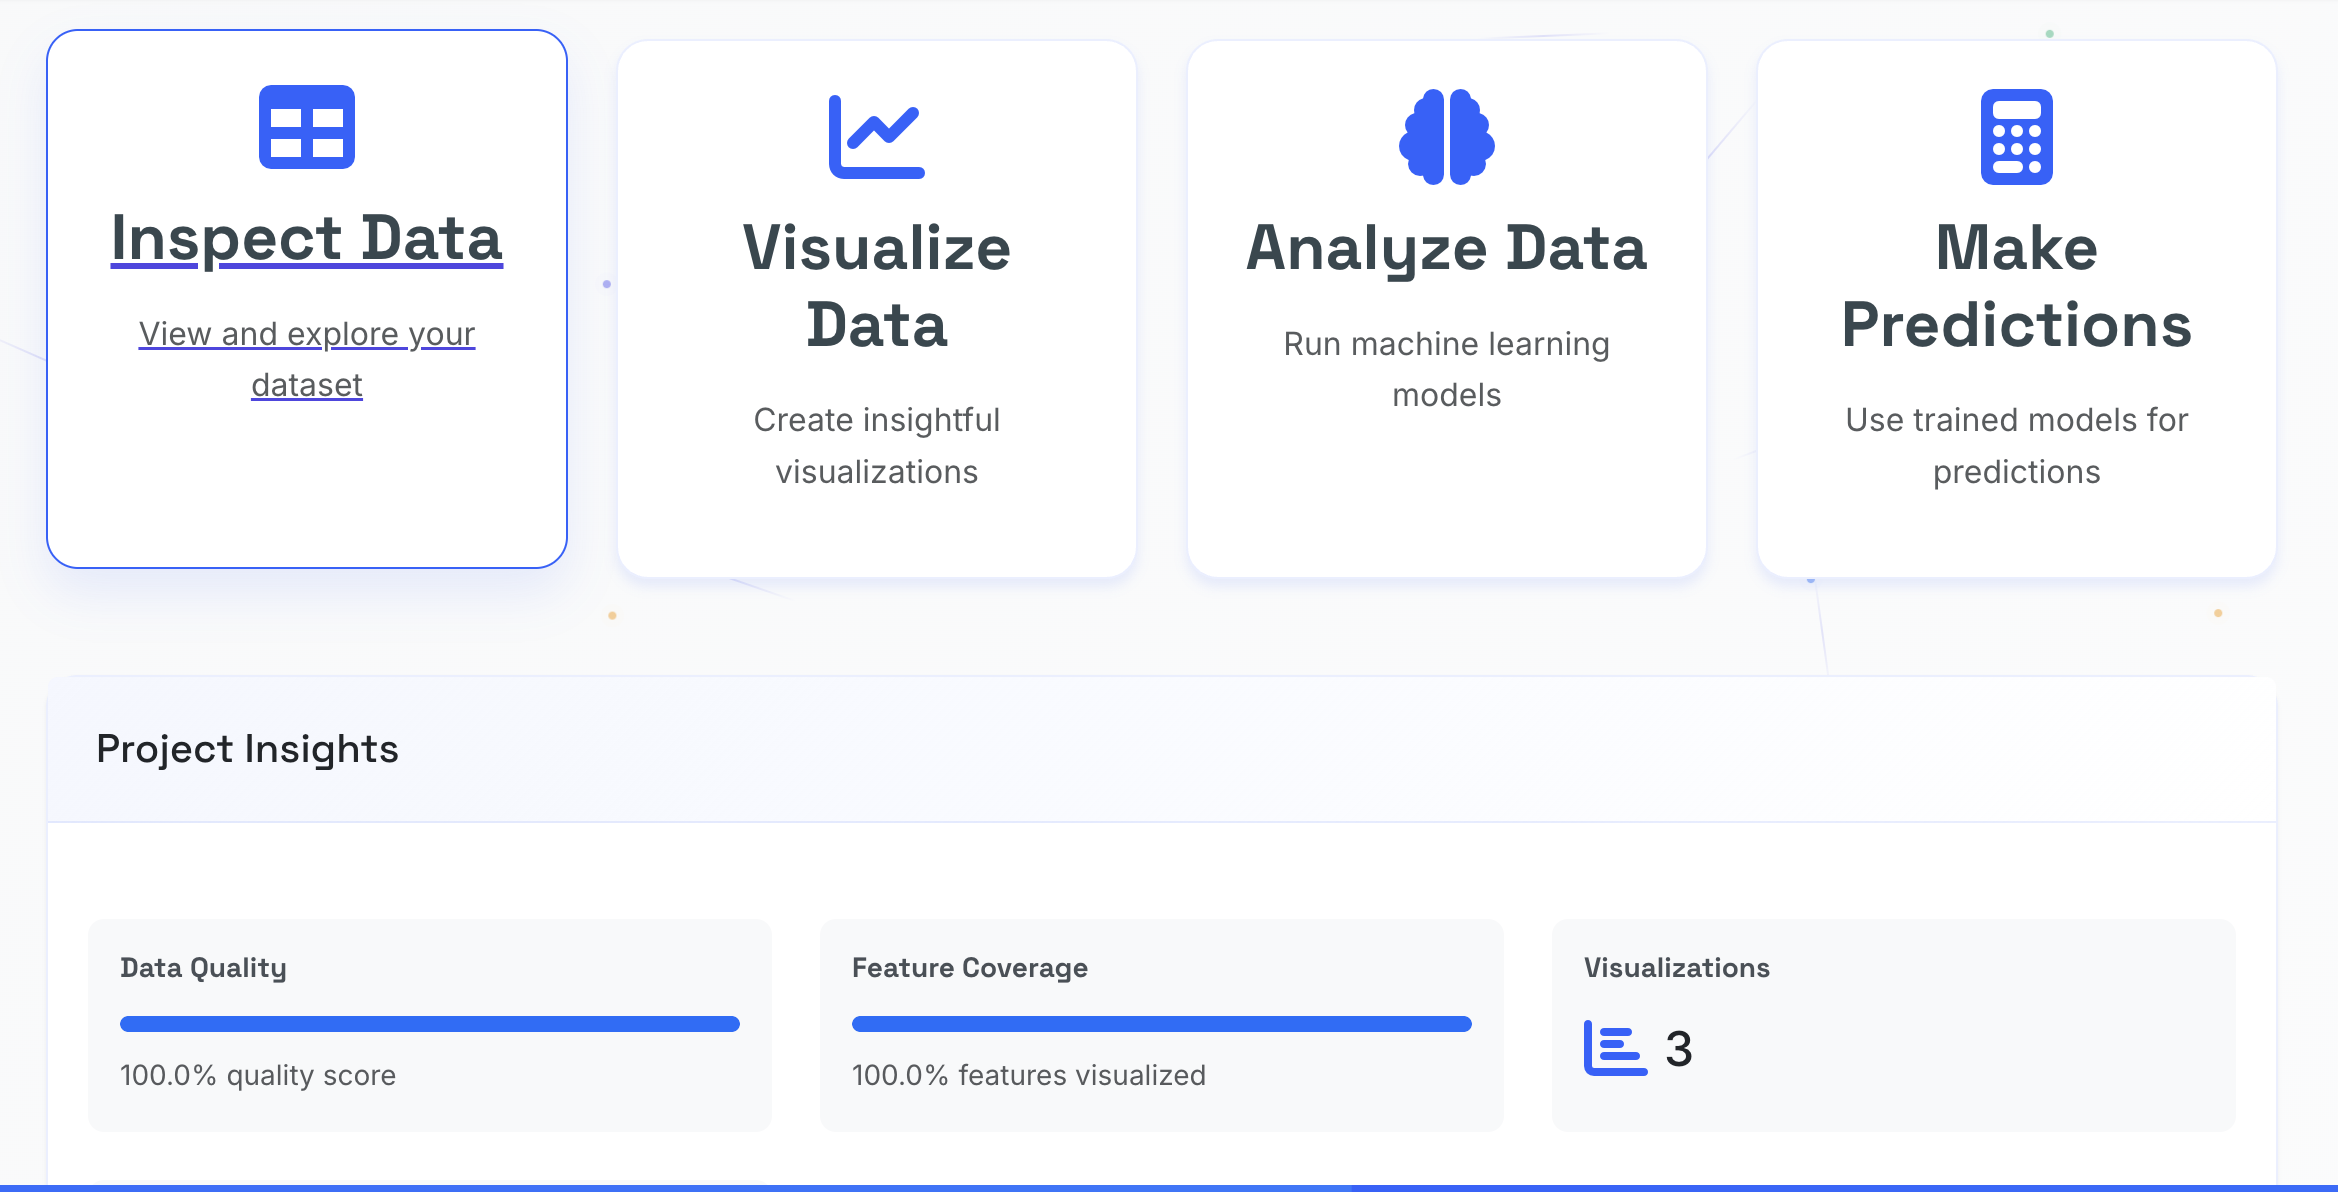
Intelligence Evolved
25+ machine learning algorithms, 20+ statistical tests, 35+ visualization types. All accessible through an intuitive interface — no coding required.
From simple linear regression to advanced ensemble methods. Train, evaluate, and deploy models with just a few clicks.
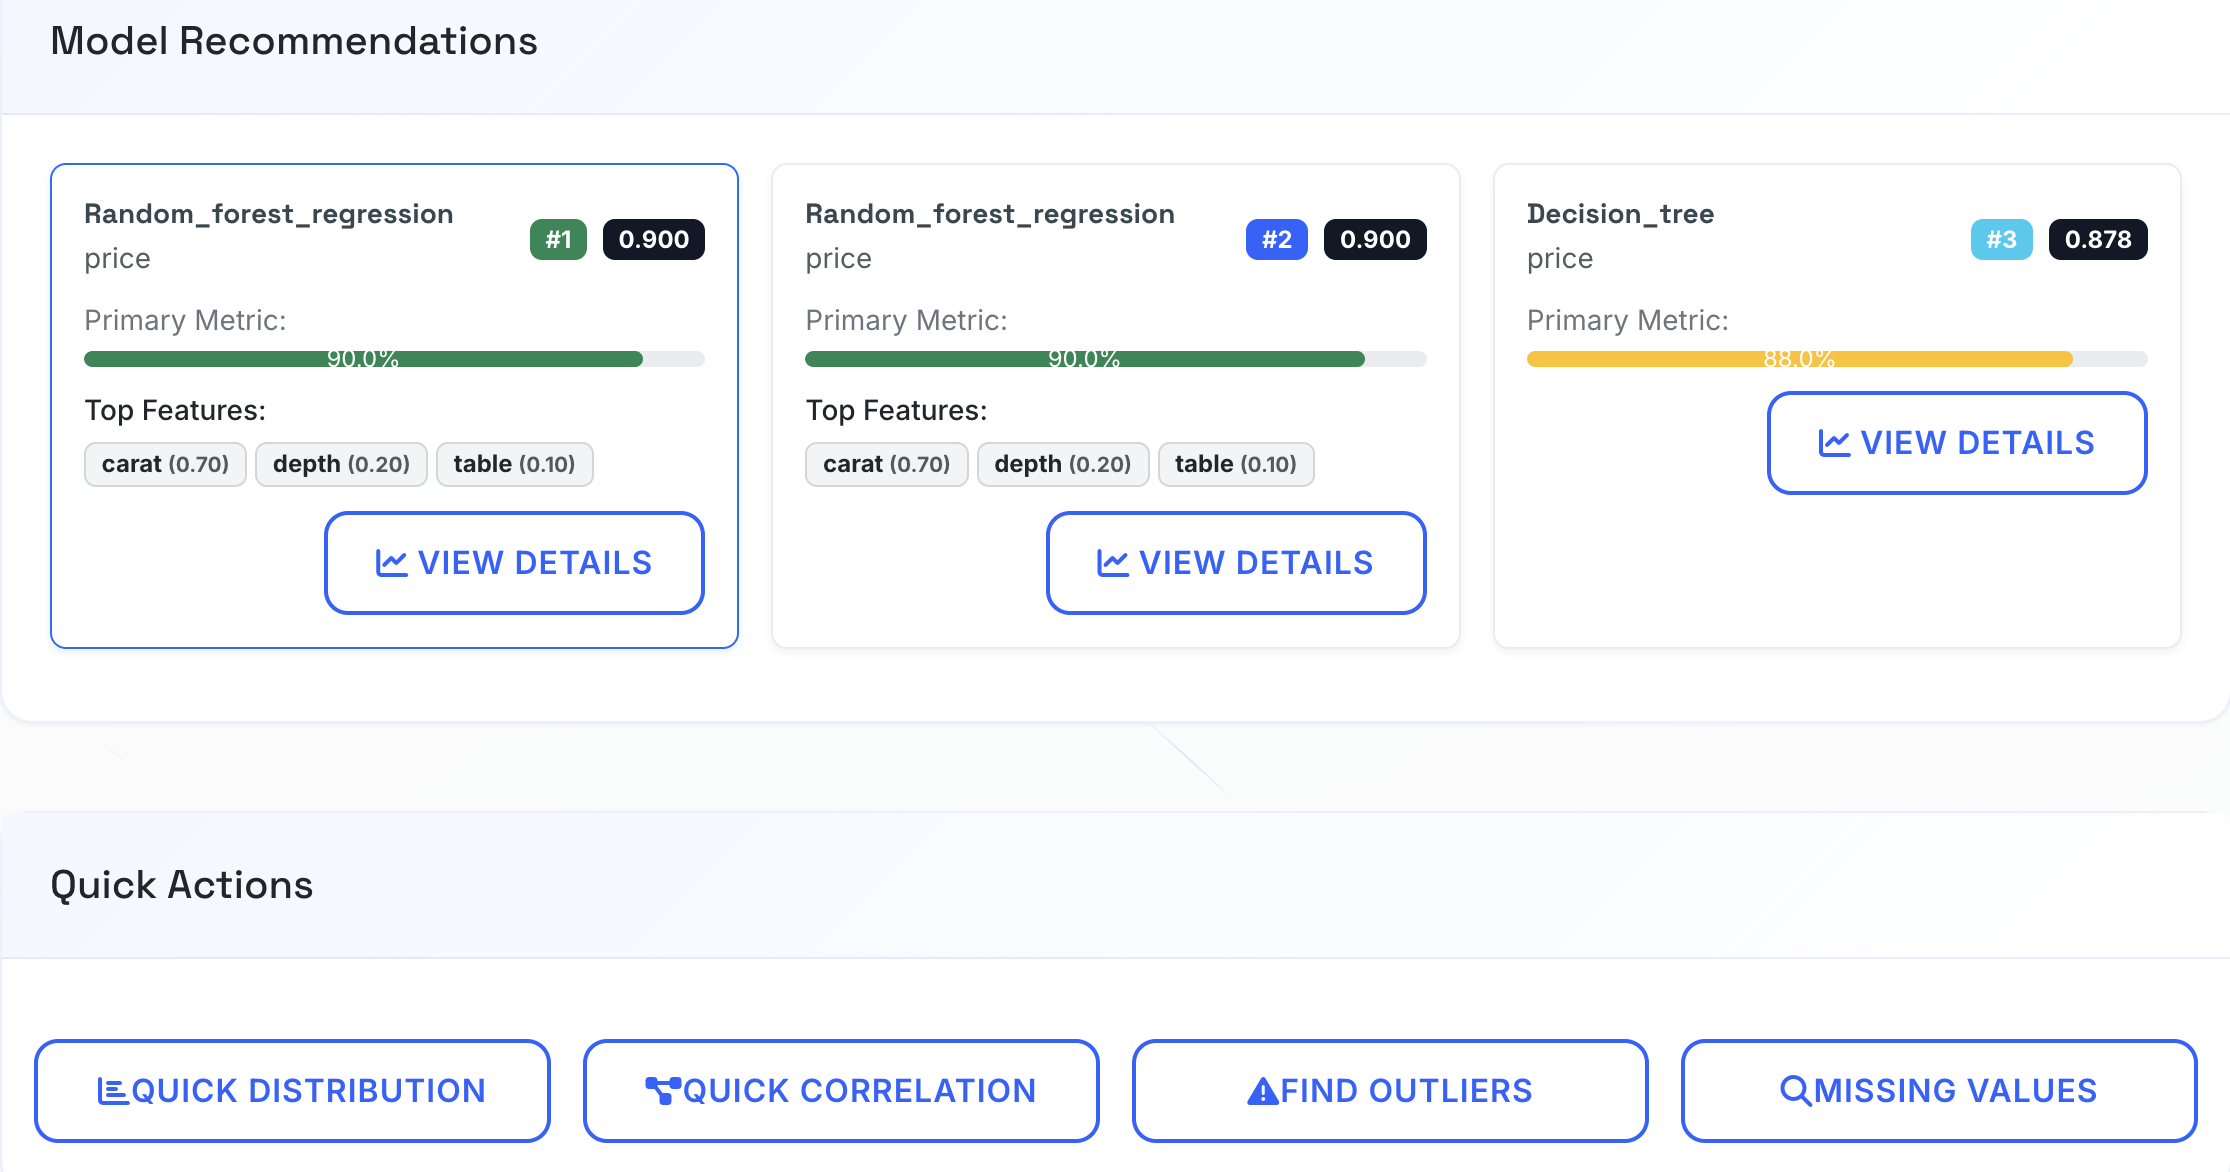
Predict continuous values like sales, prices, or quantities.
Categorize data into groups like spam/not spam, churn/retain.
Discover natural groupings in your data without labels.
Predict future values based on historical patterns.
Simplify complex datasets while preserving key information.
Let the system find the best model automatically.
Rigorous hypothesis testing with plain-English interpretations. No statistics degree required.
Compare groups and determine if differences are significant.
Measure relationships between variables.
Analyze relationships in categorical data.
Check data distributions and assumptions.
Every statistical test comes with a clear interpretation. You'll know exactly what your p-value means and whether your results are significant — no statistics background needed.
Try It FreeInteractive, publication-ready charts powered by Plotly. Explore your data visually and share insights with stakeholders.
Bar, Line, Scatter, Pie, Area, Histogram
Box, Violin, Heatmap, Correlation Matrix
3D Scatter, Sunburst, Treemap, Sankey
Choropleth Maps, Scatter Maps, Bubble Maps
Clean, transform, and prepare your data for analysis. Automated suggestions help you fix issues quickly.
Automatic detection of missing values, duplicates, outliers, and data type issues.
Multiple imputation strategies: mean, median, mode, KNN, or custom values.
One-hot encoding, label encoding, standardization, and normalization.
Filter rows by conditions, sort by columns, and create subsets of your data.
Create new columns, combine features, and extract date/time components.
Automatically split data for model training and validation.
Generate professional reports and export your work in multiple formats.
Professional reports with visualizations, metrics, and insights.
Export processed data and results for further analysis.
Download charts as PNG, SVG, or interactive HTML.
Deploy models and get predictions via REST API.